You've probably heard that half of all new businesses fail within five years. The government data mostly backs that up, but the number hides a lot. Survival depends on your industry, your state and, more than anything, how much cash you keep on hand.
This page uses the latest Bureau of Labor Statistics survival tables, which follow businesses opened between 1994 and 2025 through March 2026, alongside the Federal Reserve's 2026 small business survey and federal bankruptcy court filings. BLS counts closed establishments, and some of those closures are owners who sold, merged or retired rather than failed.
Every figure links to the agency or organization that produced the data.
Key Takeaways About 1 in 5 new US businesses closes within its first year: 78.9% of establishments opened in the year to March 2025 were still open a year later (BLS, Business Employment Dynamics Table 7: Total Private , Oct 2026).Fewer than half survive five years: 47.2% of establishments opened in the year to March 2021 were still open in March 2026 (BLS, Business Employment Dynamics Table 7: Total Private , Oct 2026).Only 34.2% of businesses opened in the year to March 2016 were still operating 10 years later (BLS, Business Employment Dynamics Table 7: Total Private , Oct 2026).12.0% of the businesses opened in the year to March 1994 are still open 32 years later (BLS, Business Employment Dynamics Table 7: Total Private , Oct 2026).A record 1,065,228 new private establishments opened in the year to March 2022, nearly double the 569,387 that opened in the year to March 1994 (BLS, Business Employment Dynamics Table 7: Total Private , Oct 2026).US business bankruptcy filings rose 12.5% in a year, to 27,054 in the 12 months to September 30, 2026 (Administrative Office of the U.S. Courts, Table F-2, September 30, 2026 , Sep 2026).Only 47% of small employer firms were operating at a profit at the end of 2024 (Federal Reserve Banks, Small Business Credit Survey: 2026 Report on Employer Firms , Mar 2026).54% of small employer firms struggled to pay operating expenses in the prior 12 months (Federal Reserve Banks, Small Business Credit Survey: 2026 Report on Employer Firms , Mar 2026).The typical US small business held just 17.6 days of cash in 2025 (JPMorganChase Institute, Small Business Snapshot: Philadelphia , Oct 2026).Information businesses have the lowest five-year survival rate of any industry, at 41.4% (BLS, Business Employment Dynamics Table 7: Information , Oct 2026).Washington DC has a lower five-year business survival rate than any state, at 37.0% (BLS, Business Employment Dynamics Table 7: District of Columbia, Total Private , Oct 2026).22% of small businesses that applied for financing received none of it (Federal Reserve Banks, Small Business Credit Survey: 2026 Report on Employer Firms , Mar 2026).How many small businesses fail? Half is a fair rule of thumb, and it has held for three decades. The risk falls fast, though: a business that gets through year five is far more likely to make it to year fifteen.
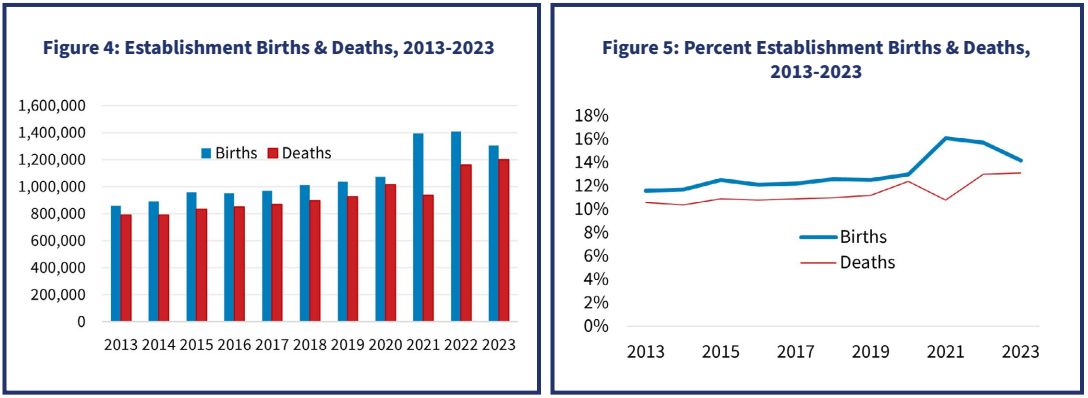
Figure 1: Openings have outrun closures every year for a decade, but closures climbed to about 1.2 million in 2023, the highest in the series. Source: SBA Office of Advocacy, Frequently Asked Questions About Small Business, Figures 4 and 5 , Feb 2026. Chart published by the source, rendered from the PDF and captured November 7, 2026.
What percentage of businesses fail in the first year? About 21% of new establishments close within twelve months, and that rate has barely moved in 30 years.
Of the 839,297 establishments opened in the year to March 2021, 79.1% were still open a year later (BLS, Business Employment Dynamics Table 7: Total Private , Oct 2026). The 1994 cohort had almost exactly the same first-year survival rate, 79.6% (BLS, Business Employment Dynamics Table 7: Total Private , Oct 2026). 969,316 new establishments opened in the year to March 2026, the latest cohort BLS tracks (BLS, Business Employment Dynamics Table 7: Total Private , Oct 2026). Businesses opened in the year to March 2020, at the start of the pandemic, did slightly better than average: 80.9% survived year one (BLS, Business Employment Dynamics Table 7: Total Private , Oct 2026). What percentage of businesses fail within five years? Slightly more than half. The long-run average from 1994 to 2022 puts five-year survival just under 50%.
How many businesses last 10, 15 or 20 years? About a third reach ten years, and about a quarter reach fifteen. The odds improve sharply once a business passes year five.
The average ten-year survival rate from 1994 to 2022 was 33.9% (SBA Office of Advocacy, Frequently Asked Questions About Small Business , Feb 2026). The average fifteen-year survival rate was 25.5% (SBA Office of Advocacy, Frequently Asked Questions About Small Business , Feb 2026). 69.5% of businesses that reach five years go on to reach ten (SBA Office of Advocacy, Frequently Asked Questions About Small Business , Feb 2026). 76.1% of establishments that reach ten years also reach fifteen (SBA Office of Advocacy, Frequently Asked Questions About Small Business , Feb 2026). 18.6% of establishments opened in the year to March 2006 were still open 20 years later (BLS, Business Employment Dynamics Table 7: Total Private , Oct 2026). Of the 1994 cohort, 33.6% were still operating in 2004 (BLS, Business Employment Dynamics Table 7: Total Private , Oct 2026). How many businesses open and close each year? More businesses open than close in a normal year, but closures have risen along with the boom in new starts.
Which industries have the highest failure rates? The industries with the best survival odds are the ones people call risky. Restaurants and retail outlast software, media and consulting firms, which are cheap to start and easy to walk away from.
Figure 2: Only four industries fall below the all-business average, and three of them are the low-capital service businesses many first-time founders start. Source: U.S. Bureau of Labor Statistics, Establishment Age and Survival Data , Oct 2026, data through March 2026. Chart drawn by StartFleet from the BLS Table 7 files because BLS publishes no chart, November 7, 2026.
Which industries have the best five-year survival rates? Agriculture, food service, personal services and retail lead the table.
In agriculture, 59.4% of new establishments were still open after five years, and 86.3% made it through year one (BLS, Business Employment Dynamics Table 7: Agriculture, Forestry, Fishing and Hunting , Oct 2026). In restaurants, hotels and other accommodation and food businesses, 56.3% of new establishments were still open after five years, and 86.6% made it through year one (BLS, Business Employment Dynamics Table 7: Accommodation and Food Services , Oct 2026). In other services, such as repair shops, salons and laundries, 55.4% of new establishments were still open after five years, and 83.3% made it through year one (BLS, Business Employment Dynamics Table 7: Other Services , Oct 2026). In retail, 55.2% of new establishments were still open after five years, and 83.6% made it through year one (BLS, Business Employment Dynamics Table 7: Retail Trade , Oct 2026). In manufacturing, 53.0% of new establishments were still open after five years, and 83.2% made it through year one (BLS, Business Employment Dynamics Table 7: Manufacturing , Oct 2026). In construction, 52.8% of new establishments were still open after five years, and 81.2% made it through year one (BLS, Business Employment Dynamics Table 7: Construction , Oct 2026). In arts, entertainment and recreation, 52.7% of new establishments were still open after five years, and 83.6% made it through year one (BLS, Business Employment Dynamics Table 7: Arts, Entertainment, and Recreation , Oct 2026). In real estate and rental and leasing, 52.4% of new establishments were still open after five years, and 83.4% made it through year one (BLS, Business Employment Dynamics Table 7: Real Estate and Rental and Leasing , Oct 2026). In health care and social assistance, 52.1% of new establishments were still open after five years, and 85.2% made it through year one (BLS, Business Employment Dynamics Table 7: Health Care and Social Assistance , Oct 2026). Which industries are close to the average? Most other sectors sit within a few points of the all-business average.
In utilities, 50.3% of new establishments were still open after five years, and 79.2% made it through year one (BLS, Business Employment Dynamics Table 7: Utilities , Oct 2026). In educational services, 49.0% of new establishments were still open after five years, and 79.1% made it through year one (BLS, Business Employment Dynamics Table 7: Educational Services , Oct 2026). In finance and insurance, 48.9% of new establishments were still open after five years, and 78.3% made it through year one (BLS, Business Employment Dynamics Table 7: Finance and Insurance , Oct 2026). In management of companies, 48.3% of new establishments were still open after five years, and 80.2% made it through year one (BLS, Business Employment Dynamics Table 7: Management of Companies and Enterprises , Oct 2026). In mining, quarrying and oil and gas, 47.7% of new establishments were still open after five years, and 78.1% made it through year one (BLS, Business Employment Dynamics Table 7: Mining, Quarrying, and Oil and Gas Extraction , Oct 2026). In wholesale trade, 47.6% of new establishments were still open after five years, and 81.6% made it through year one (BLS, Business Employment Dynamics Table 7: Wholesale Trade , Oct 2026). Which industries fail most often? Information, transportation and professional services do worst. Each is easy to enter, so more of the businesses that start there are marginal.
In administrative and waste services, 46.4% of new establishments were still open after five years, and 77.3% made it through year one (BLS, Business Employment Dynamics Table 7: Administrative and Waste Services , Oct 2026). In professional, scientific and technical services, 44.7% of new establishments were still open after five years, and 77.1% made it through year one (BLS, Business Employment Dynamics Table 7: Professional, Scientific, and Technical Services , Oct 2026). In transportation and warehousing, 44.2% of new establishments were still open after five years, and 80.3% made it through year one (BLS, Business Employment Dynamics Table 7: Transportation and Warehousing , Oct 2026). In information, which includes software publishers, media and telecom, 41.4% of new establishments were still open after five years, and 74.2% made it through year one (BLS, Business Employment Dynamics Table 7: Information , Oct 2026). Business survival rates by state Where you register a business changes its odds less than its industry does. The gap between the best and worst still runs to 19 points at five years.
Figure 3: The popular LLC states, Wyoming, New Mexico and Delaware, all sit below the national average, which reflects the businesses located there rather than their LLC laws. Source: U.S. Bureau of Labor Statistics, Establishment Age and Survival Data, state tables , Oct 2026, data through March 2026. Chart drawn by StartFleet from the BLS state Table 7 files, November 7, 2026.
What are survival rates in the popular LLC formation states? These figures count businesses that actually operate in each state, not companies that are only registered there. A Wyoming LLC run from abroad doesn't show up in Wyoming's numbers.
Wyoming: 42.9% five-year survival and 76.3% one-year survival for the 2021 cohort (BLS, Business Employment Dynamics Table 7: Wyoming, Total Private , Oct 2026). Delaware: 45.9% five-year survival and 77.5% one-year survival for the 2021 cohort (BLS, Business Employment Dynamics Table 7: Delaware, Total Private , Oct 2026). New Mexico: 42.0% five-year survival and 75.8% one-year survival for the 2021 cohort (BLS, Business Employment Dynamics Table 7: New Mexico, Total Private , Oct 2026). Florida: 45.2% five-year survival and 76.6% one-year survival for the 2021 cohort (BLS, Business Employment Dynamics Table 7: Florida, Total Private , Oct 2026). Texas: 48.6% five-year survival and 79.1% one-year survival for the 2021 cohort (BLS, Business Employment Dynamics Table 7: Texas, Total Private , Oct 2026). Nevada: 43.2% five-year survival and 79.2% one-year survival for the 2021 cohort (BLS, Business Employment Dynamics Table 7: Nevada, Total Private , Oct 2026). What are survival rates in other large states? California and Minnesota sit above the national average, while Tennessee, Utah and Oregon sit well below it.
California: 51.5% five-year survival and 85.9% one-year survival for the 2021 cohort (BLS, Business Employment Dynamics Table 7: California, Total Private , Oct 2026). New York: 45.9% five-year survival and 78.8% one-year survival for the 2021 cohort (BLS, Business Employment Dynamics Table 7: New York, Total Private , Oct 2026). Illinois: 49.6% five-year survival and 78.1% one-year survival for the 2021 cohort (BLS, Business Employment Dynamics Table 7: Illinois, Total Private , Oct 2026). Georgia: 43.1% five-year survival and 75.1% one-year survival for the 2021 cohort (BLS, Business Employment Dynamics Table 7: Georgia, Total Private , Oct 2026). Pennsylvania: 50.7% five-year survival and 80.7% one-year survival for the 2021 cohort (BLS, Business Employment Dynamics Table 7: Pennsylvania, Total Private , Oct 2026). Ohio: 50.0% five-year survival and 78.7% one-year survival for the 2021 cohort (BLS, Business Employment Dynamics Table 7: Ohio, Total Private , Oct 2026). North Carolina: 49.4% five-year survival and 78.8% one-year survival for the 2021 cohort (BLS, Business Employment Dynamics Table 7: North Carolina, Total Private , Oct 2026). Colorado: 43.3% five-year survival and 76.9% one-year survival for the 2021 cohort (BLS, Business Employment Dynamics Table 7: Colorado, Total Private , Oct 2026). Arizona: 44.8% five-year survival and 77.5% one-year survival for the 2021 cohort (BLS, Business Employment Dynamics Table 7: Arizona, Total Private , Oct 2026). Michigan: 51.3% five-year survival and 78.0% one-year survival for the 2021 cohort (BLS, Business Employment Dynamics Table 7: Michigan, Total Private , Oct 2026). Massachusetts: 48.4% five-year survival and 81.0% one-year survival for the 2021 cohort (BLS, Business Employment Dynamics Table 7: Massachusetts, Total Private , Oct 2026). New Jersey: 46.8% five-year survival and 79.7% one-year survival for the 2021 cohort (BLS, Business Employment Dynamics Table 7: New Jersey, Total Private , Oct 2026). Virginia: 45.6% five-year survival and 77.4% one-year survival for the 2021 cohort (BLS, Business Employment Dynamics Table 7: Virginia, Total Private , Oct 2026). Tennessee: 43.1% five-year survival and 78.8% one-year survival for the 2021 cohort (BLS, Business Employment Dynamics Table 7: Tennessee, Total Private , Oct 2026). Indiana: 50.6% five-year survival and 80.3% one-year survival for the 2021 cohort (BLS, Business Employment Dynamics Table 7: Indiana, Total Private , Oct 2026). Minnesota: 51.2% five-year survival and 77.4% one-year survival for the 2021 cohort (BLS, Business Employment Dynamics Table 7: Minnesota, Total Private , Oct 2026). Oregon: 43.6% five-year survival and 77.4% one-year survival for the 2021 cohort (BLS, Business Employment Dynamics Table 7: Oregon, Total Private , Oct 2026). Utah: 43.4% five-year survival and 75.8% one-year survival for the 2021 cohort (BLS, Business Employment Dynamics Table 7: Utah, Total Private , Oct 2026). Maryland: 44.2% five-year survival and 72.6% one-year survival for the 2021 cohort (BLS, Business Employment Dynamics Table 7: Maryland, Total Private , Oct 2026). Which states have the highest and lowest survival rates? Washington DC, Missouri and Washington state sit at the bottom, and West Virginia and Puerto Rico at the top.
Puerto Rico: 56.0% five-year survival, the highest in the BLS state tables (BLS, Business Employment Dynamics Table 7: Puerto Rico, Total Private , Oct 2026). Washington: 40.9% five-year survival and 82.9% one-year survival for the 2021 cohort (BLS, Business Employment Dynamics Table 7: Washington, Total Private , Oct 2026). Missouri: 39.9% five-year survival and 72.7% one-year survival for the 2021 cohort (BLS, Business Employment Dynamics Table 7: Missouri, Total Private , Oct 2026). West Virginia: 53.4% five-year survival and 80.1% one-year survival for the 2021 cohort (BLS, Business Employment Dynamics Table 7: West Virginia, Total Private , Oct 2026). Rhode Island: 41.4% five-year survival and 70.4% one-year survival for the 2021 cohort (BLS, Business Employment Dynamics Table 7: Rhode Island, Total Private , Oct 2026). Why do small businesses fail? Most small businesses that close run out of cash while costs rise faster than sales. The Federal Reserve's 2026 survey shows how many owners are already covering gaps from their own pockets.
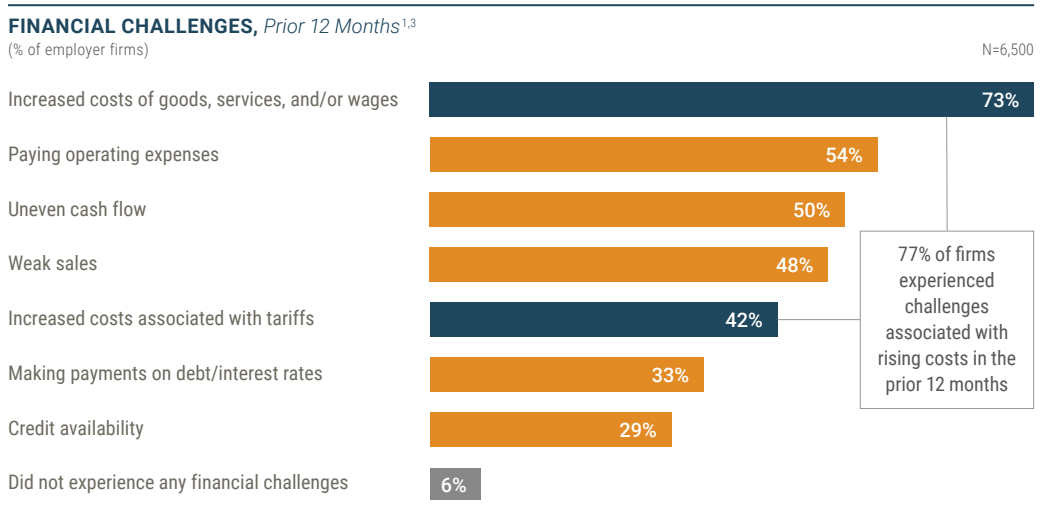
Figure 4: Rising costs topped every other financial problem, and more than half of firms struggled just to cover payroll, rent and inventory. Source: Federal Reserve Banks, Small Business Credit Survey: 2026 Report on Employer Firms , Mar 2026. Chart published by the source, rendered from the PDF and captured November 7, 2026.
What financial problems do small businesses face? Costs, cash flow and weak sales, in that order.
73% of small employer firms said higher costs of goods, services or wages were a financial challenge (Federal Reserve Banks, Small Business Credit Survey: 2026 Report on Employer Firms , Mar 2026). 50% reported uneven cash flow (Federal Reserve Banks, Small Business Credit Survey: 2026 Report on Employer Firms , Mar 2026). 48% reported weak sales (Federal Reserve Banks, Small Business Credit Survey: 2026 Report on Employer Firms , Mar 2026). 42% said tariff-related cost increases were a financial challenge (Federal Reserve Banks, Small Business Credit Survey: 2026 Report on Employer Firms , Mar 2026). 33% struggled to make debt or interest payments (Federal Reserve Banks, Small Business Credit Survey: 2026 Report on Employer Firms , Mar 2026). 29% cited credit availability as a challenge (Federal Reserve Banks, Small Business Credit Survey: 2026 Report on Employer Firms , Mar 2026). Only 6% of firms reported no financial challenges at all (Federal Reserve Banks, Small Business Credit Survey: 2026 Report on Employer Firms , Mar 2026). What operational problems do small businesses face? Finding customers is the hardest part of running the business, ahead of hiring.
How profitable are small businesses? Fewer than half make money in a given year.
How long can a small business survive without revenue? Not long. Most small businesses would run out of cash in under three weeks if sales stopped.
What do owners do when money runs short? Many owners fund the gap themselves, which puts personal savings on the line.
If you're forming a US LLC from abroad, the same rule applies: get the business bank account working early so revenue has somewhere to land. StartFleet's formation plans cover filing, the registered agent, the EIN and bank account setup assistance.
Small business bankruptcies and new business starts Bankruptcies are rising, but they're still a small slice of all closures, since most owners who close simply stop trading. Meanwhile new business openings are still well above their pre-2021 levels, so the pool of young, high-risk businesses keeps growing.
Figure 5: Business filings rose in every chapter, led by Chapter 7 liquidations. Source: Administrative Office of the U.S. Courts, Table F-2 , Sep 2026. Chart drawn by StartFleet from the court tables, November 7, 2026.
How many businesses file for bankruptcy each year? About 27,000 a year, out of more than 36 million small businesses.
15,602 business Chapter 7 (liquidation) cases were filed in the 12 months to September 30, 2026 (Administrative Office of the U.S. Courts, Table F-2, September 30, 2026 , Sep 2026). Business Chapter 11 (reorganization) filings reached 9,453 (Administrative Office of the U.S. Courts, Table F-2, September 30, 2026 , Sep 2026). In the previous 12 months, to September 30, 2025, there were 24,039 business bankruptcy filings (Administrative Office of the U.S. Courts, Table F-2, September 30, 2025 , Sep 2025). Business cases were 4.4% of all 621,111 bankruptcy filings in the year to September 30, 2026 (Administrative Office of the U.S. Courts, Table F-2, September 30, 2026 , Sep 2026). How many new businesses are starting? Applications are running above half a million a month, though only a small share become employers.
How many small businesses are there? The US has more than 36 million small businesses, and most have no employees.
There are 36,207,130 small businesses in the US (SBA Office of Advocacy, Frequently Asked Questions About Small Business , Feb 2026). 82.3% of small businesses, 29,811,495 firms, have no employees (SBA Office of Advocacy, Frequently Asked Questions About Small Business , Feb 2026). Small businesses employ 45.9% of private sector workers, 62.3 million people (SBA Office of Advocacy, Frequently Asked Questions About Small Business , Feb 2026). Methodology and Sources We only used data from the agency or organization that produced it: the BLS Business Employment Dynamics survival tables, the SBA Office of Advocacy, the Federal Reserve Banks' Small Business Credit Survey, the JPMorganChase Institute, the Administrative Office of the U.S. Courts and the Census Bureau. We didn't use statistics roundups or secondhand citations. BLS survival rates track private establishments with employees, so they leave out nonemployer businesses and count every closure, including sales and retirements, as an exit. We refresh this page monthly and update the BLS figures each fall when the new survival tables come out.
Glossary BLS : U.S. Bureau of Labor Statistics.BED : Business Employment Dynamics, the BLS program that publishes establishment survival tables.Establishment : a single physical business location. One firm can have several.Cohort : all establishments that opened in the same 12-month period, tracked over time.Nonemployer firm : a business with no paid employees.SBCS : Small Business Credit Survey, run by the 12 Federal Reserve Banks.Cash buffer days : how many days a business could cover its normal outflows from cash on hand if all revenue stopped.Chapter 7 / Chapter 11 : bankruptcy liquidation and bankruptcy reorganization.Sources U.S. Bureau of Labor Statistics, Establishment Age and Survival Data (national, industry and state Table 7 files)SBA Office of Advocacy, Frequently Asked Questions About Small Business, February 2026 Federal Reserve Banks, Small Business Credit Survey: 2026 Report on Employer Firms JPMorganChase Institute, Small Business Snapshot: Philadelphia Administrative Office of the U.S. Courts, Table F-2, September 30, 2026 Administrative Office of the U.S. Courts, Table F-2, September 30, 2025 U.S. Census Bureau, Business Formation Statistics